Sunday, July 25, 2010

Homeland Security: Protect


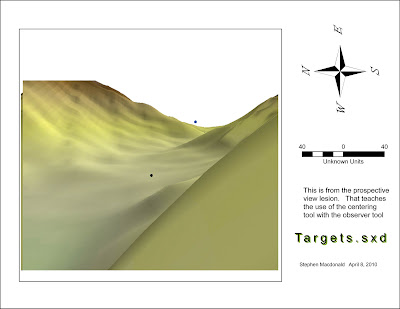
The Line of Sight Process is deceptive in the plan view even with the profile view. The 3D version of the drivers side camera position clearly shows that positions only sees the roof of the incoming vehicle, and is therefore a bad spot for the camera.
I am still not clear on the black dot green dot thing. I need to put more time on this process.

Saturday, July 17, 2010

Homeland Security


This series was very didactic. It reinforced existing skills. I am glad the information was already collected. I tried to down load some of it. The files are large and it took forever.

Monday, July 5, 2010


I had a little trouble geocoding the addresses of the police stations, after that it was smooth sailing.

Tuesday, June 22, 2010

Location Selection


Neet stuff, I had no real problem, but I had an issue with the environment settings. The school distances would not take the shape of the county until I selected the mask from the tool application.

Tuesday, June 15, 2010

Saturday, June 12, 2010

2010 Oil Spill

Module 5: Participation —Process summary
Stephen Macdonald June 12, 2010

http://students.uwf.edu/scm19/Spill.avi

SPILL EXTENT.AVI

http://students.uwf.edu/scm19/closures.avi

FISHERIES CLOSURES.AVI

The Role of GIS and the 2010 Gulf Oil Spill

I think that the response has come together as if it were pre planned. The mere scope of the problem is mind boggling. When I first heard of it on television I was under the impression that the now infamous blowout preventer worked and the size of the spill was 200 barrels. Then it was thousands of gallons. Now they are talking about millions of barrels. It is hard to believe that almost a third of the Gulf is covered with oil.

As I did the research for the .avi I was looking at the .pdf’s and shapefiles for the fisheries closures and I could tell that the mapping being provided by NOAA was evolving. The product being provided and fields in the shape files were becoming more definitive, complete, and more professional looking.

The amount of work that went into the Geo referenced photography was impressive. The clarity and density of the photography was good. The CAP logo on the photography in region 2 was good to see. My daughter was in the CAP for years. All that training is being put to good use. There is no doubt that booming around Big Lagoon State Park was in place on June 02, 2010.

This stuff is great. I defiantly want to be a GIS Chief when I grow-up.


PROCESS SUMMARY
BP Gulf Oil Spill 2010
Fisheries closure time line

1. Explore the data.
a. Google NOAA for fisheries closure files
b. Search the archives for shapefiles
c. down load the imagery layer from ESRI

2. Deliverables:
• Produce an .avi
• And process summary
• Post to blog

Build Database

Import the shapefiles into a data base.
This made it easier to experiment with the Animation tool.

Add layers

1. Imagery Layer
2. 15 Fishery Closures shapefiles from May 02, 2010 to June 07, 2010

Process: Fisheries Closure

I once I found the animation tool I fooled around with it to see if I could figure it out without reading the instructions. When that failed I Googled Animation ESRI AcrGis 9.3. I got some interesting instruction for animating a time line. I tried to figure out how to put a polygon into an excel file. That failed. I Googled group animation ESRI ArcGIS 9.3 got the instructions. Started a new map tried it out. Worked the first time. Then I tested it in the blog. I had to open my blog outside the server to see the Quicktime movie. Looked good so I went back built a better map with neat lines then exported the .avi again. Looks OK Needs some work, but it took a half of a day.

Process: Oil Spill

After I reviewed the assignment I determined that the specific instructions were for the oil spill. I downloaded the information from the R: drive and I could reset the projection for the spill shape files, so I went to geoComons.com and down loaded them again. I opened a new document and added the state and Neighboring countries files then added the spill shape files and standardized the colors and made an ,avi and loaded it on to the I: drive.

ESI Map


Monday, May 31, 2010


Storm Surge vs. Wetland

The low coastal plane is susceptible to inundation in a surge situation up to the coastal ridge which could get a double whammy from the surge and scour from the back wash. It is doubtful that the occasional storm surge over geological time is detrimental to the wetlands in that the species native to the area are uniquely adapted to the area and a scour of this type had the effect of removing an overgrowth of the understory thereby allowing for the cleaner environment for the dominate species of the local environment to procreate.

Thursday, April 8, 2010

Tuesday, March 9, 2010

Largest Gulf County Land Owners

The largest land owner in Gulf County is the St Joseph Land & Development Company which owns 80% of the land. It was a subsidiary of St. Joe Paper which was a subsidiary of DuPont. The paper mill closed in 1998.

Current development in the County appears to focus on attracting high-end tourists to the County’s over 40 miles of sandy white beaches.

Unfortunately the commercial industrial base is virtually nonexistent. The Florida Department of Transportation is planning a more direct access to Mexico Beach. The name of the project is Gulf Coast Parkway. Two of the alternate routes cut through cut through St. Joseph’s Property and Emerging Growth Timber Land. That would be an opportunity for the development of hunt clubs.

A hunt club is a type of High-End residential subdivision that is environmentally friendly, managed, benefactored preserve that have large conservation easements, and the valuable home sites improve the tax base.


http://gulfcoastparkway.com/

http://www.ohoopeeriverplantation.com/online/about

Tuesday, March 2, 2010

Data Editing


I always wondered how this worked.

Tuesday, February 23, 2010

Saturday, February 20, 2010

Political Boundary, Land Use, & Wetlands

The wetlands layer came fron the Miami-Dade GIS Department. I posted it as a hollow color over the USGS topographic map to highlite the fringe of the uplands.

DEM, DOQQ, DRG


I select this site to show the releif between the Urban areas and the preserve on the left side of the DEM there is a lake that shows up as a dark spot over the S in South Miami NW. I think that the white line next to it is part of the High Voltage grid that runs along the highway.

Roads, Cities, and Public Lands

I went to the Department of the Interior's web site and found the Stork Nesting Site Shape file. I thought it was interesting, so I posted it as evidence that I went there looking.

Tuesday, February 9, 2010

Projections Lab


The further south you go the larger the distortion.

Sunday, February 7, 2010

Haiti


I found these layers on the ESRI resource page, and I put them together with ArcGIS.

Monday, February 1, 2010

States of Mexico


Central Mexico


I got an overflow error when I tried to annotate the World_Countries layer. I just typed Mexico on the layout view.

Topographic Relief


I inverted the color ramp in order to see the coastal plain better.

Monday, January 25, 2010

World Population


I would like more control of sizing the image to the frame. I need to be able to customize the North Arrow.

Saturday, January 16, 2010

Potential Youth Center Locations


I was surprised that the database wasn't updated to the file the map.mxd was saved to. That could cause usability issues after the project is distributed.

Wednesday, January 13, 2010

Plan a Trip to San Diego


I learned the zoom box, that is helpful. I could not change the properties of the interstate symbol.

About Me

My photo
I graduated from University of West Florida in 2017 with a 3.0 GPA and 188 credit hours. I have 24 credit hours in Geographic Information Science

Followers